Your incident response is broken

When your app goes down, the first question is always the same: "What changed?" But answering that question means checking GitHub, Slack, AWS, and your monitoring tool—all separately. It takes 30+ minutes of context switching.
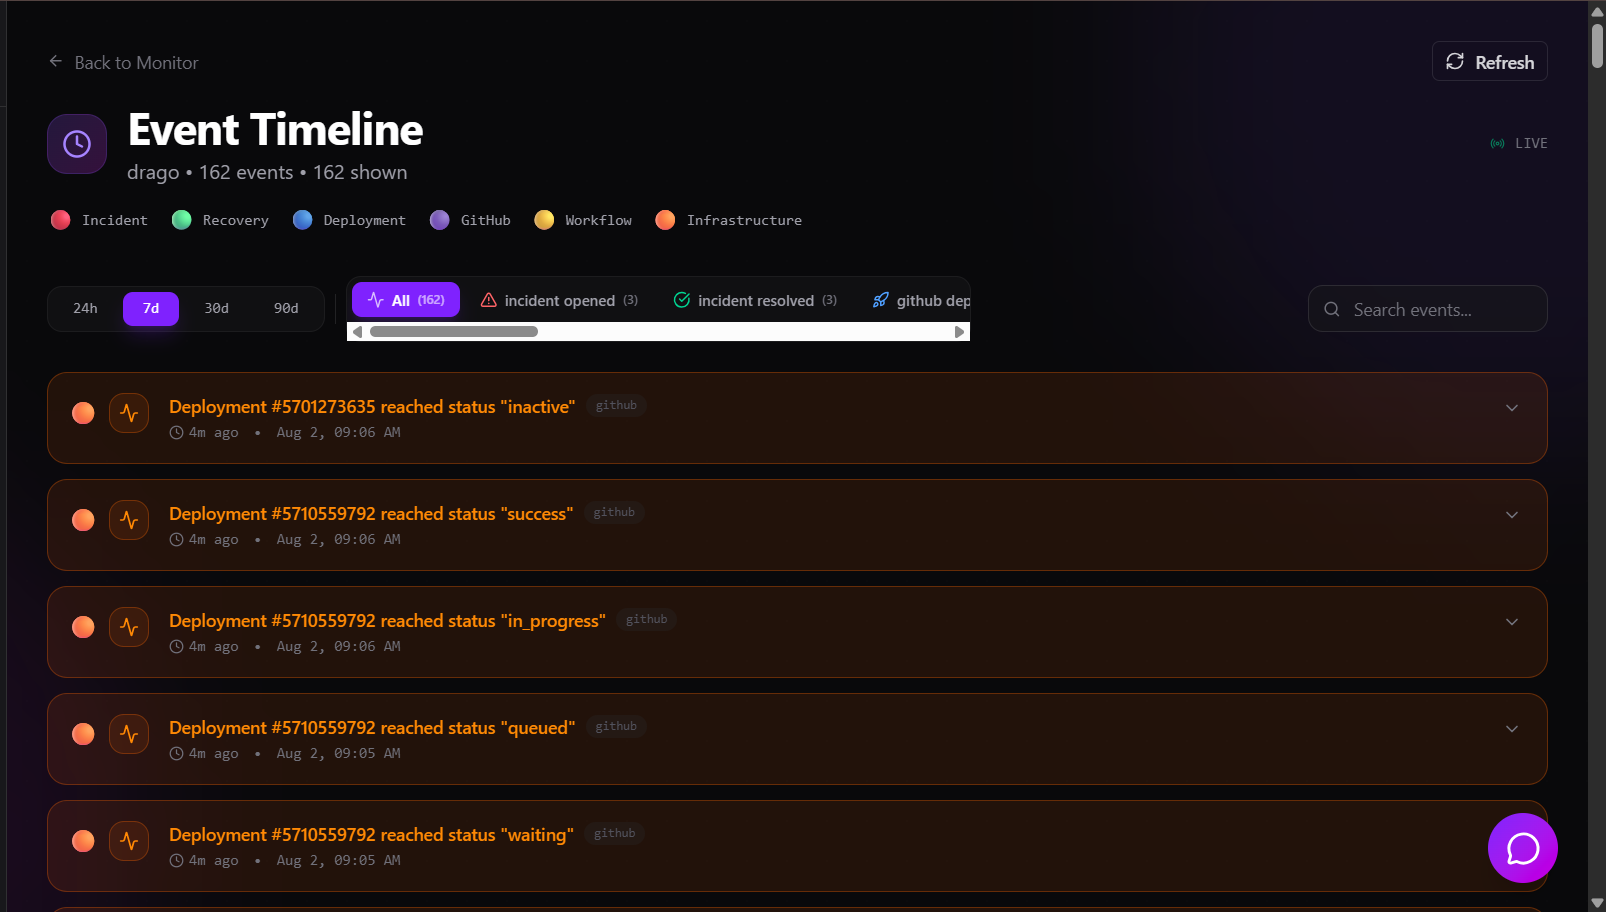
We built PulseBoard's new Event Timeline to fix this.
One unified feed. Every deployment, commit, incident, workflow, and infrastructure event. Chronologically. Color-coded. Filterable. You see exactly what changed—and when—in under 10 seconds.
No more guesswork. No more chaos. Just clear evidence of what broke and who to ask about it.
Ship with confidence. Investigate with clarity.
Comments (2)

The 30 minutes of context switching you named is the real cost most monitoring tools ignore, they show you the outage but leave you to hunt through four other tabs for the cause. Chronological and color coded is the right call, most incident timelines are just a wall of text. One thing I would want to know: when two deployments land within minutes of each other, does the timeline help narrow down which one actually caused the incident, or does that part still fall to the person investigating?
Md_haseeb, the thirty plus minutes of context switching across GitHub, Slack, AWS, and the monitoring tool is the real cost here, more than the outage itself. Most teams only feel that tax during an incident, when they are least able to absorb it calmly. Once someone has the unified timeline running for a few weeks, do they actually stop checking the individual tools separately, or do those old habits stick around out of caution?
Sign in to comment or upvote.